Here is a very early version of the Ottoneu Surplus Calculator, I have pre-loaded it with dollar values (FGPts only for now!) based on the just released Steamer 2018 projections. I hope to have values for the other three formats loaded sometime in the next week, and right now this early SC has no additional features since last year’s version , but I have some new features I will be testing and adding soon.
A few important instructions before you use the sheet:
The sheet I’ve linked is locked for editing, so you must make a copy and save it to your own Drive to use it. Just click on File:Make a copy to do so.
Once you’ve made a copy of the sheet, enter the league # you want to run through the Calc in B17 on the Team Totals tab, everything else will load automatically once you’ve done that
The Team Roster tab will let you select any team in your league and sort that team using a few different options. There are other tabs showing the Free Agents in your league, and Arb Targets (the positive surplus players for each team).
One quick note on the dollar values- I made no adjustments to the Steamer projections other than adding in estimated holds for RP. There are some free agents (like Eduardo Nunez) that had no playing time assigned, and others had some strange PA/G or IP projections, so just keep that in mind as you review the dollar values. As always, I encourage everyone to use their own values, or make adjustments to the ones I preload, using the Custom Values tab.
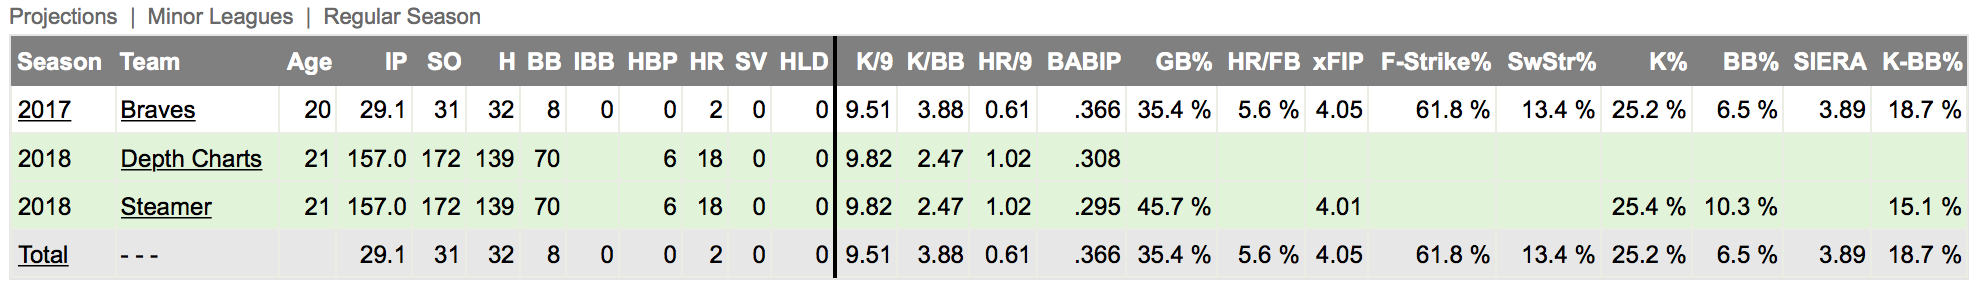
This actually made me look at Gohara’s steamer projection and to be honest, I don’t think $17 is all that crazy. His K rate may be a touch high and his HR/9 will be the biggest factor, but I can easily see a season somewhere between $15 - $25.
The Steamer ROS projections for Gohara caught my eye late last year, it’s why I own him in a few spots. Lots of volatility for any young pitcher, but he has the pedigree.
Ok @vibbot last year Judge had a ridiculous season at 8.37 P/G. You had him worth $59, the highest of any OF. For 2018, Steamer has Trout at 8.6 P/G, and your Calc has him worth $78. My assumption is that the gap between 8.37 P/G and 8.6 P/G is not $19, but that the projections (Steamer) assume a lot less production for all other OF outside of Trout, making his 8.6 P/G and the gap to the next best (Harper) pretty wide. Yes?
Now looking at Harper, it looks like he’s projected (Steamer) at 8.1 P/G for 2018. I guess the interesting thing here is that last year Judge was worth just $59 at 8.37, but this year in the projections Harper is worth $61 at 8.1 P/G. The gap in projected value ($19) between Trout (#1) and Harper (#2) make sense; the fact that the rest of the OF class is projected so far below Harper to make his 8.1 P/G now worth $61 has me scratching my head. Per the 2015 end-of-year values, Harper’s 8.76 P/G (his monster outlier year) was worth $66. Next closest was Trout at $52 at 7.60 P/G.
I updated the $ values for all four formats, the changes are likely small but I tweaked the positional baselines I was using based on data I compiled from 30 first year FGPts auctions in '17
I changed the $ value tabs for the four formats to automatically import values from an external sheet. The benefit of this is that even if you don’t have the most up to date SC, the default $ values will be up to date.
Thanks for this tool! I have already found it useful.
Would you mind sharing the methodology of how the $ values are created? When I put the FGPts parameters into the auction calculator I get very different dollar values than the ones assigned here. I am guessing this may be related to one or more of the following:
Different pitcher/hitter % breakdown
Difference between the steamer projections on the fg website and the ones in this tool
different methodology of calculating dollar values than what fg auction calculator uses.
Any ideas? Thanks again for all the work that went into this tool.
I plan on posting a detailed breakdown of how I calculate $ values later this winter, but for now I’ll respond to your comments:
Yes, I don’t force a hitter/pitcher % split based on calculated points above replacement, but instead enforce a 62/38% split based on many auctions worth of observed behavior
There shouldn’t really be any difference between the Steamer projections I used for the SC $ values and those used on the auction calculator, other than changes due to players changing teams since I last updated my values
This is the biggest reason, the auction calculator doesn’t make any adjustments for PPG/PIP and instead just uses total points to assign value. In a format like Ottoneu that uses G/IP caps I think that’s a mistake. You can mitigate that somewhat by using the Experimental option under League Settings in the auction calculator, but even then the dollar values it produces don’t sit well with me.
Another question: I see that your list of players above replacement includes 33-34 players per team and about $380 per team. Does this account for the fact that most drafts do not end with an owner filling out their entire 40-person roster, and having $20 left over to use in free agency? And how might that impact dollar values of players if more money is spent on the auction?