Here you’ll find a Sheet of 2016 final season stats, by player, for FGPTS. This sheet will be updated periodically throughout the off season and is a good resource if you need to download player stats for analysis, etc.
Among players with 50+ PA, your 2016 high scorer in Pt/PA and P/G? Gary Sanchez
Yup, even higher than Trout in that small sample.
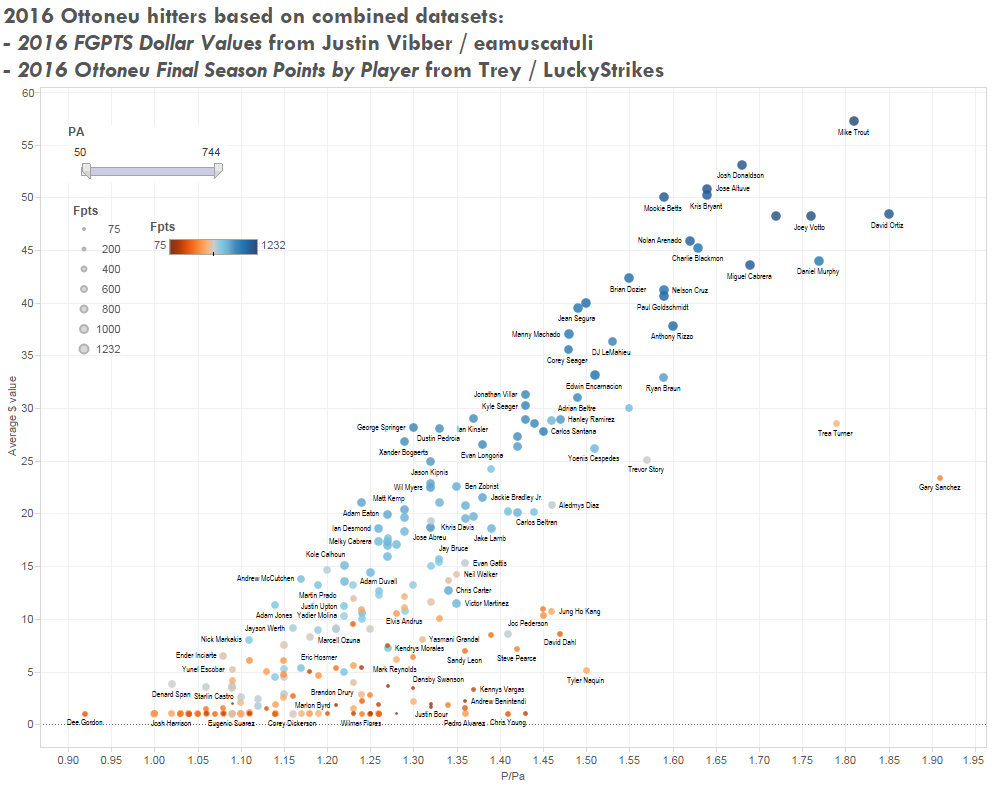
Now we’re talking! So by combining the google sheet provided by @vibbot above and the one by @LuckyStrikes here I can now combine player points with value, as well as their 2017 positions. The number of records even match, although I’m starting to think you guys work together and just take turns publishing?
You guys rock!
1 Like
So if I am reading this right, your positive outliers (good production for value) are, naturally enough, the youth - sanchez, turner, naquin, dahl - and some guys who were the youth last year whose prices did not get overly inflated yet - kang, pederson. Story, Murphy, and Ortiz also stand out and all make sense. I don’t see any crazy positive outliers that I can’t really explain logically enough. Because the points are done without regard to position but values account for position, we would expect the 1B-types to be more likely to pop out as outliers to the right of the curve, and sure enough, Ortiz, Votto, even Miggy and Rizzo, and at the bottom Bour, Alvarez, and Vargas all appear, while we would expect MI types to venture off to the left.
Dee Gordon looks so sad off by himself, too.
Hi @chy924,
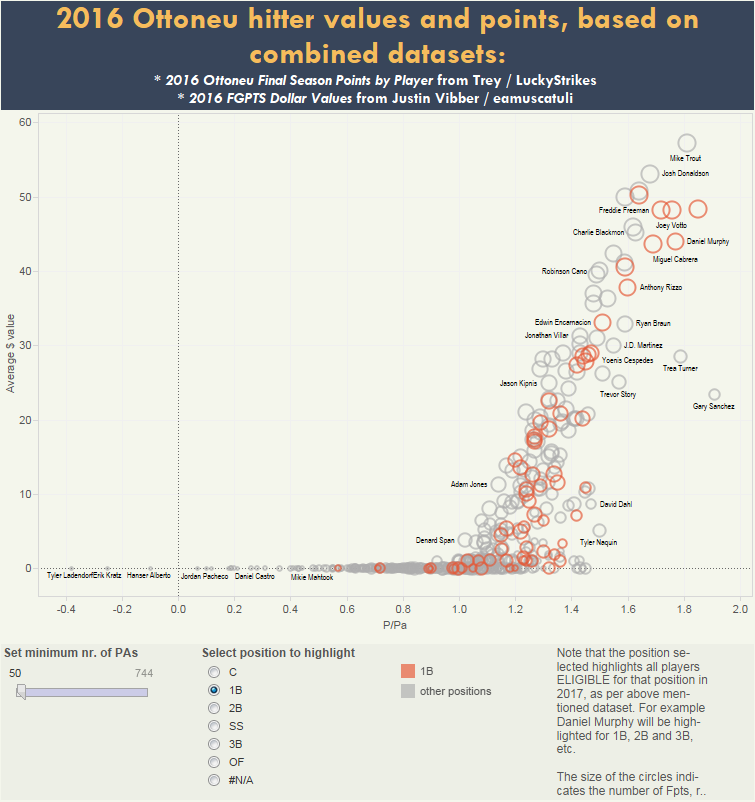
Yes I think you’re reading it correctly. I wanted to color the points by position, but that becomes somewhat complicated as many players are eligible for multiple positions. I will extend this dashboard and add a position filter, and then publish it online so that people can look at this data per position they are interested in. Screenshots are more to show there are different ways to look at this data, but usually create more questions than give answers.
RJ
I updated the graph and made one for pitchers too. The interactive versions are here (use the tabs switch between hitters and pitchers, and use the position filter to highlight players eligible for specific positions)), but here are some screenshots:

Cheers,
RJ
1 Like
These are exceptional. Thanks for putting these out @rjweise
1 Like
@LuckyStrikes and @vibbot,
I combined your data sources into a sheet (split by pitcher and hitter). Not sure if that adds value to either one of you, but since you were so kind to share your data here is the link to the combined files
Basically it reads the data directly from both your existing Google sheets (so if you update those files they get updated in the combo file too) and than has two sheets that adds the “missing” columns from one to the other. The H Comb and P Comb tabs are the combined files. They are linked based on PlayerIDs and I did a comparison between the content of the two files, with only a handful of records with slightly different points. As they were only players that wouldn’t necessarily show up in top 100 lists and such, and the differences were minimal I didn’t go through the effort of filtering them out.
Did you guys use a customised report on Fangraphs to pull this, and then added you points / values based on playerIDs?
1 Like
RJ if you pull the data by going through Ottoneu first (not FanGraphs), it should include a column for the YTD points, so I think I went that route (and yes, I do have a custom report I pull that I can access that way).
I think Niv will be updating the player database soon so that we can pull 2017 positions more easily for all players, not just those in this end of season scoring file.
Thanks for doing this.
A super handy 2016 season-ending stat resource for @everyone in the community.