I’d like to compile average auction values, particularly for all new leagues in a particular year. Is there any way to get a list of leagues by year they started?
I have this data and this reminded me of some stuff I meant to do early this season. Don’t go too far down this path, as I’ll have something for you soon.
Thanks @nivshah. Basically I thought new league auctions would provide a good data set to use to look for player valuation patterns. I saw @davecarlton412’s value of a dollar question and started wondering, “what do managers spend $1 on? Or $10 instead of $11?”
1 Like
Ok, this isn’t EXACTLY what you asked for, but I think this s pretty useful. I have had a hidden “First year leagues only” feature on the Average Values page since before the 2018 season. Now if you visit the Average Values page you can check a box that will limit the average values to leagues formed after August of the previous year. So right now, that shows only average values from leagues formed after August 1, 2017.
You can export these values into XML and CSV as well.
Once we hit January 1, 2019, this page will not be very useful until drafts start again. I’m noting that because I’m sure there’s a way for me to fix it, but it’s early and I’ve only had one cup of coffee so I’ll fix that logic as soon as I can.
This will work great. I’d love the raw data so I could draw fancier plots, but I can use the averages just as well.
To clarify – If I click “First Year Leagues Only” I will be getting salaries only from leagues started in 2018? The data includes free agent signings as well as drafted players? The prices are pre-inflation and pre-arbitration?
Just an fyi: we were a first year league last year in ottoneu. But it wasn’t a fresh draft. We maintained an economy and inflation/arbitration system over the last 4 years. When we imported the rosters we had a few outliers, but mostly matched up close to ottoneu average salary, iirc. Small set of dates points, of course, but not a true draft- pre-arb, pre-inflation. And I doubt we are the only ones to bring in their own salaries.
2 Likes
Ah, good questions!
- Any league founded after August 1, 2017.
- Yes, all transactions for those leagues
- Not pre-inflation or pre-arbitration right now.
These are the answers to your questions right now, and in answering those questions its clear that the first-year leagues filter is not representing what it is meant to represent. The goal is to see how the most recent pristine auction drafts have played out - not commissioner entered values, not post-inflation/arbitration, but what is happening in an auction draft room.
I think this should be extractable, and I think that is what the first-year leagues filter should represent, even if that means renaming the filter to fit that. So, consider that a thing I’m looking into.
Based on percentage owned, I can tell that exactly 29 leagues are represented and with a number like 29, I can calculate the exact ownership count for each player. It seems clear that at least two leagues were non-functional. No player is owned in more than 27 leagues.
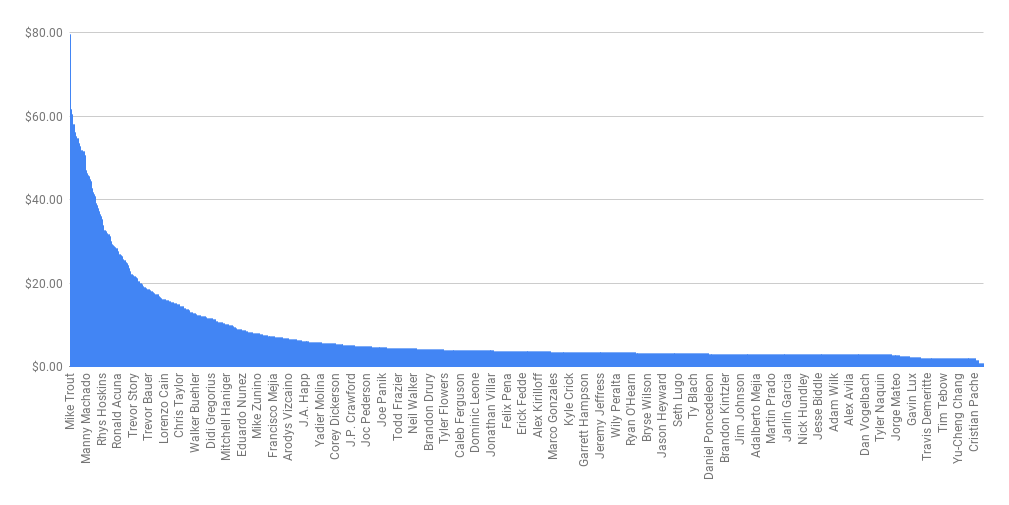
Here’s the rawest of raw charts:
3 Likes
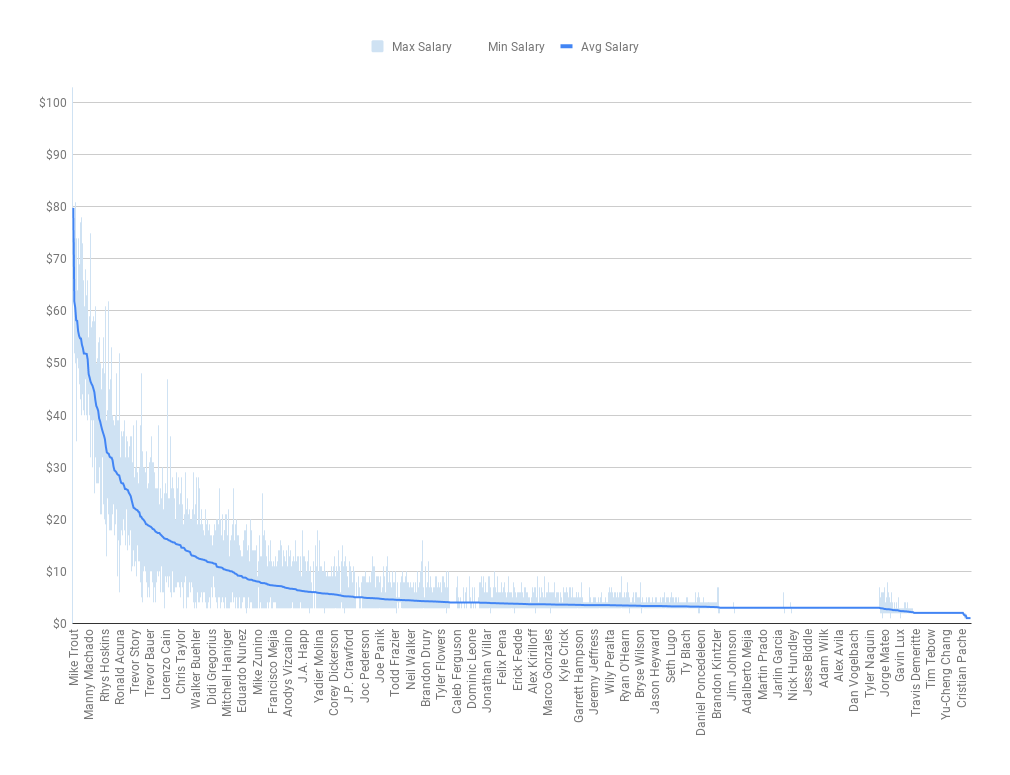
I’ve tried a few filters on the data. The attached chart is pretty simple, but shows an interesting outcome that starts to get close to what I’m after. I added min and max value ranges to each data point. Mike Trout, for example, had an average value of $80 and a min/max of $68 / $103.
2 Likes
The interesting part is the blob on the far right where a long stretch of min-value players is interrupted by a flurry of high-variability players. These are the prospects.
Austin Riley
Brendan McKay
Corey Ray
Chris Paddack
Mitch Keller
Jorge Mateo
Matt Manning
Ian Anderson
Jesus Sanchez
Dylan Cease
Carter Kieboom
Peter Alonso
Taylor Trammell
Sixto Sanchez
Hunter Greene
Luis Robert
Triston Mckenzie
Notably, these players have a lot more ownership than their veteran cohorts. For example, the last $3 player before Riley is Logan Forsythe, owned in 2 leagues. Riley is owned in 19. He has a high of $7 and a low of $2, but I believe the average also reflects the $0s of non-ownership.
2 Likes