One of the great things about Ottoneu is that there is a whole community of players building custom tools for gameplay and strategy. This is the place to grab out the latest tools and updates, so check back often.
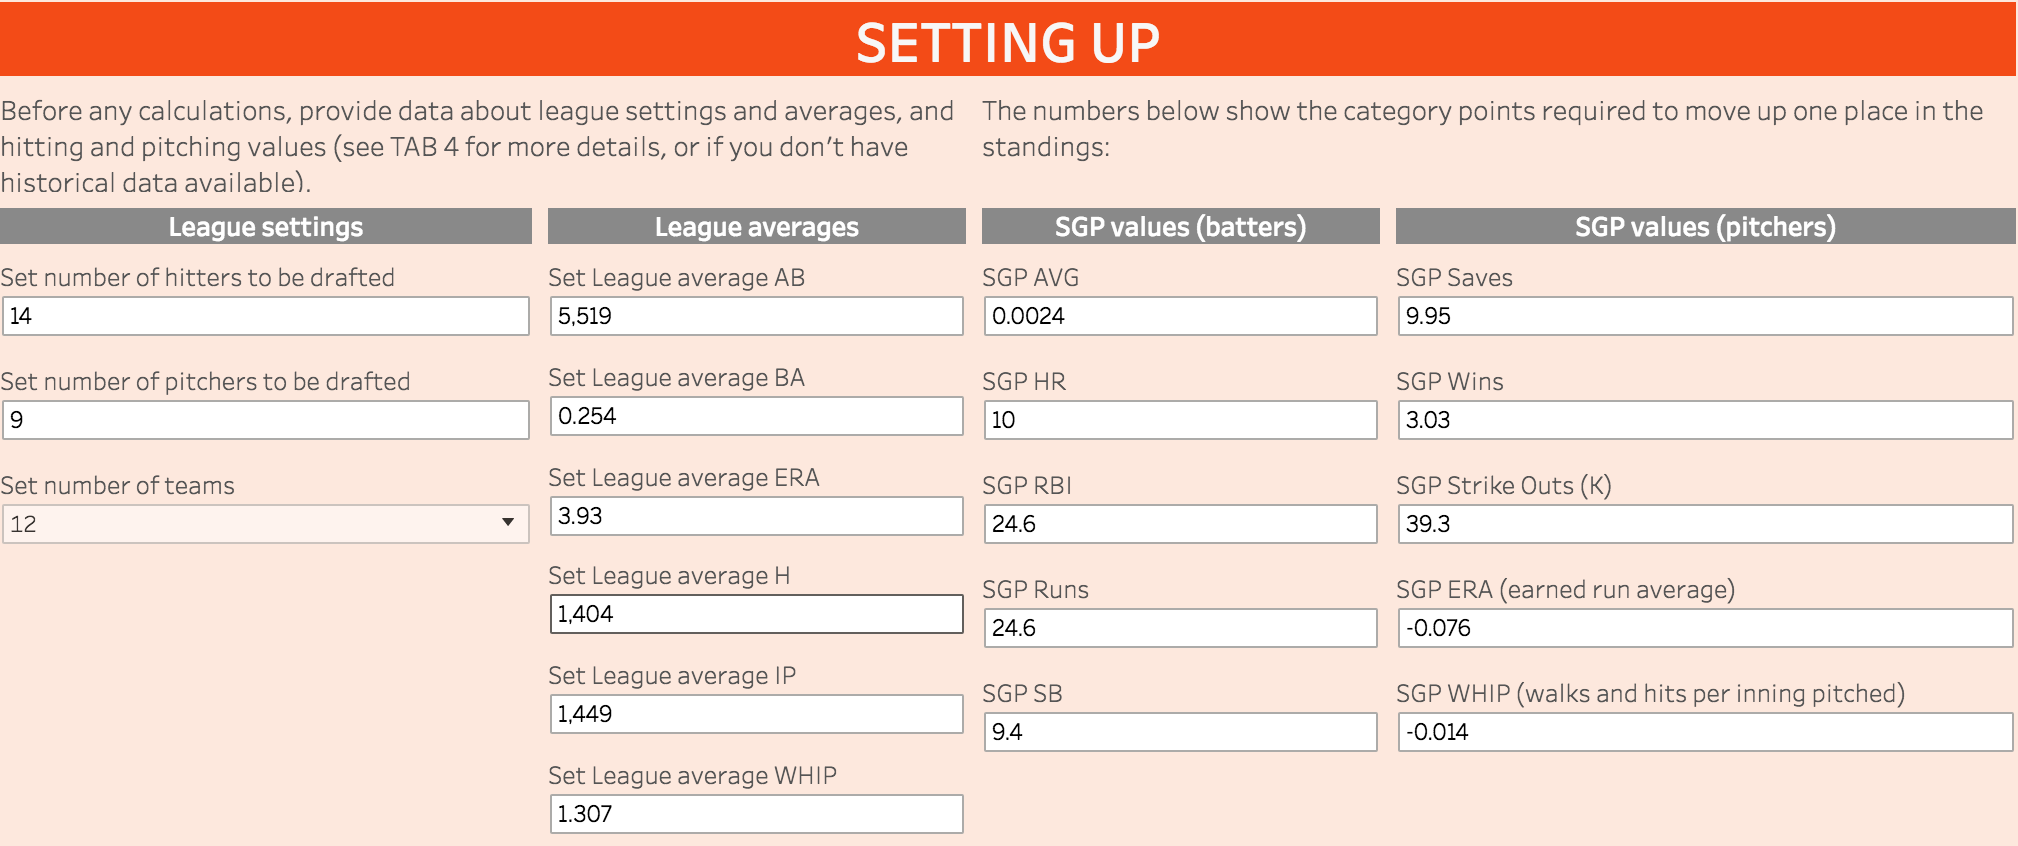
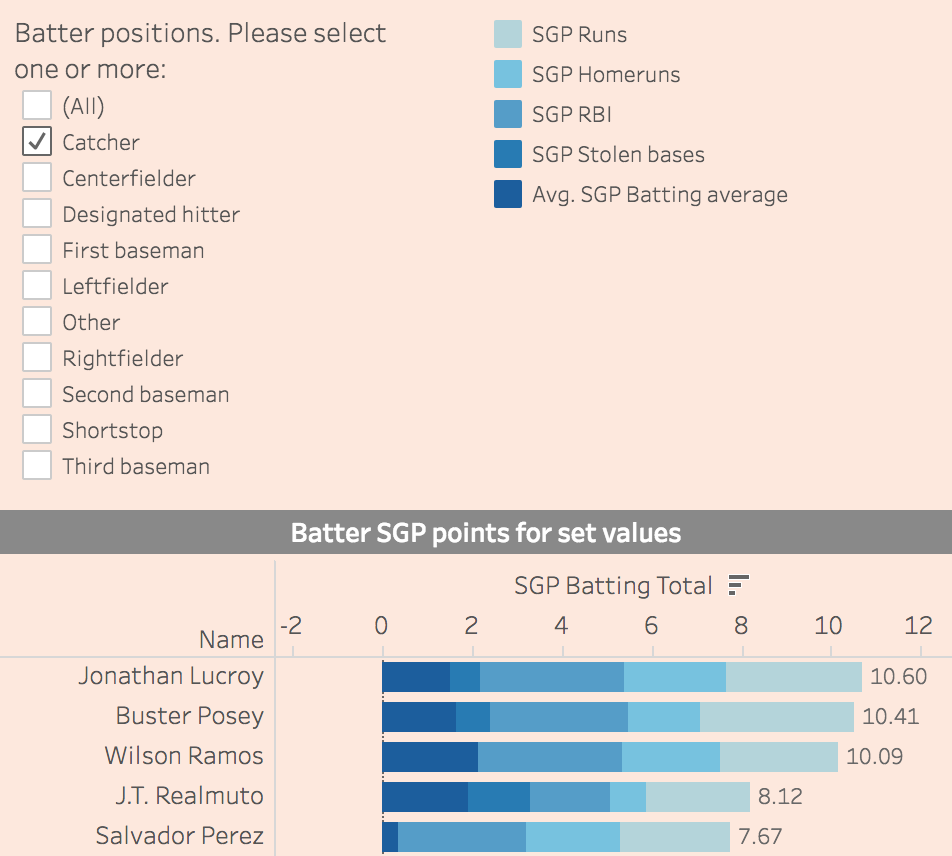
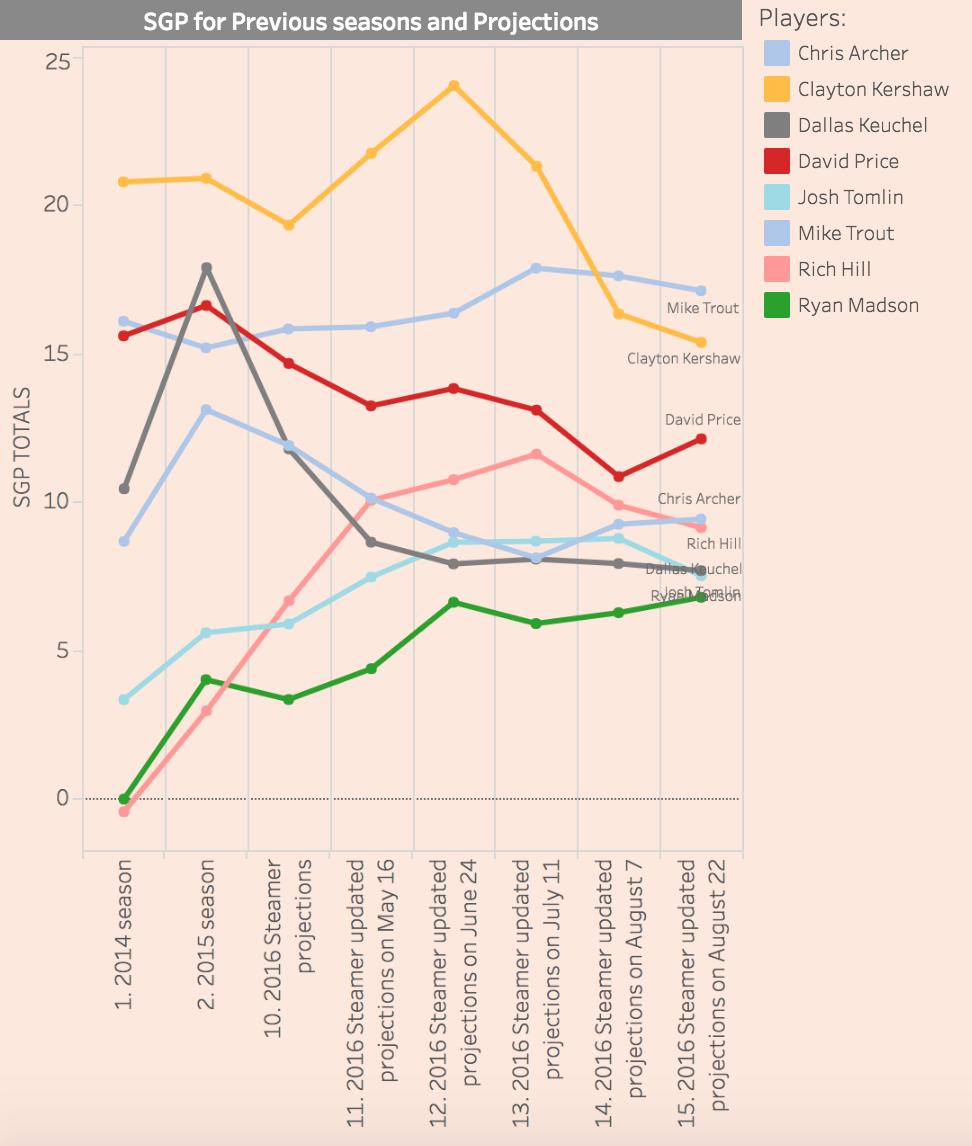
For those interested in and or working with Standing Gain Points (SGP: I built a dashboard in Tableau to do analysis of player progress over the season, based on actual stats at roughly month intervals, as well as Steamer Updated projections at those intervals. Last data update was August 22.
This is really, really cool @rjweise. A job well done. I will make a note to retweet this and “promote” it again in January/February when I think the most number of people are looking for resources heading into the new season. This is excellent - thanks for sharing with the community. This is exactly what we hope to collect here in “Tools” over time.
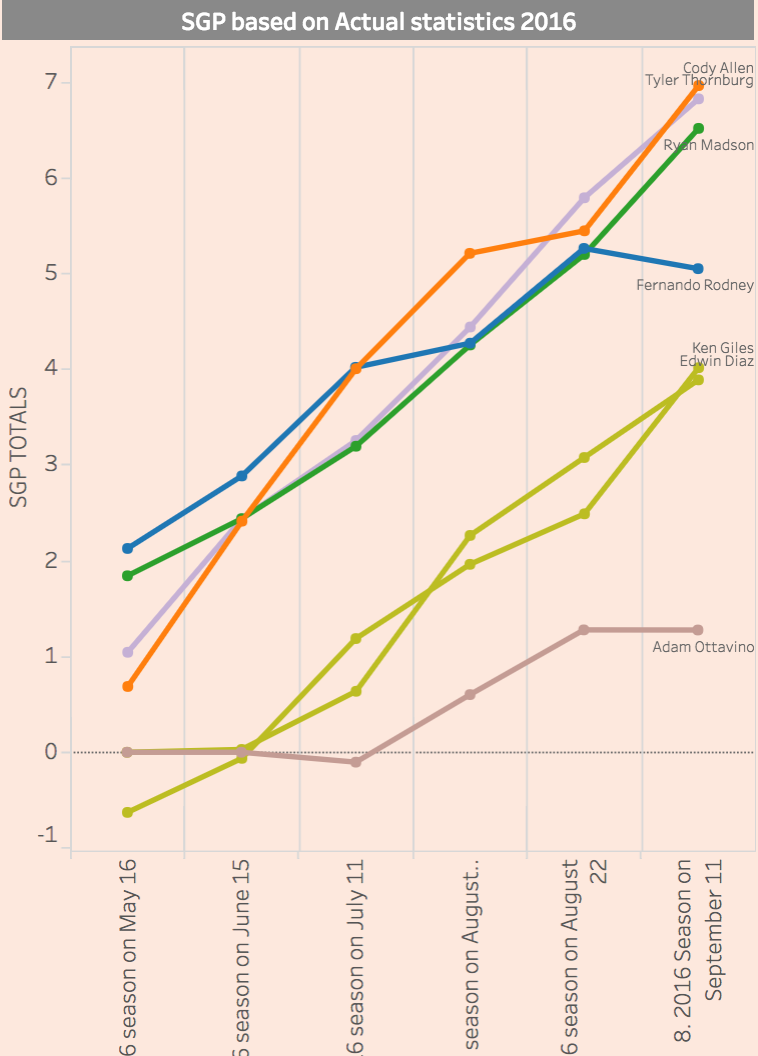
Hi everyone, please note I updated the above described tool with actual data as well as Steamer Updated projections from Fangraphs today (September 11, 2016).
Want to make some last minute changes to get a more value out of your closers? Go to the third tab and pick the players you want to compare:
Hi @LuckyStrikes,
I actually use the Steamer(updated) which to my knowledge gives a full season projection based on the ongoing season actual results. The Steamer ROS gives projected data only for the remaining games, which would look ok if shown as a ratio when comparing to other ROS projections (taken at other time stamps and as such with more games) but not so much when comparing 1-1.
When I update the report I download the Batter - actual, Batter - Steamer Updated, Pitcher - actual, and Pitcher - Steamer Updated, run a couple of SQL statements in PostgreSQL to add the relevant columns to the main table, and then replace the data source in the Tableau report with the updated version. I am looking into adding the new data in Tableau itself but will likely stick with the existing process for the remainder of the 2016 season.
I do not use the Fangraphs Depth Charts at this point. Did you have any concerns about the data?
Thanks. No concerns at all about the data. I have an idea that I will revisit in the off season with you, however. Again, thanks for putting this tool together. Terrific work.
I just updated the dashboard (This dashboard calculates Standing Gain Points (SGP) based on variables entered by the user and MLB pitcher and batter statistics from the Fangraphs website) to include the data for the whole season. Main dashboard Dashboard optimized for iPhone 6S
I think this is going to be a big, big hit later this off season (around January) when owners are looking for any edge they can to prep for their drafts.