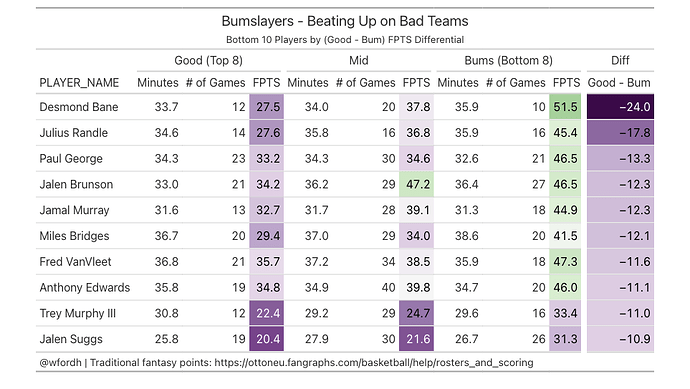
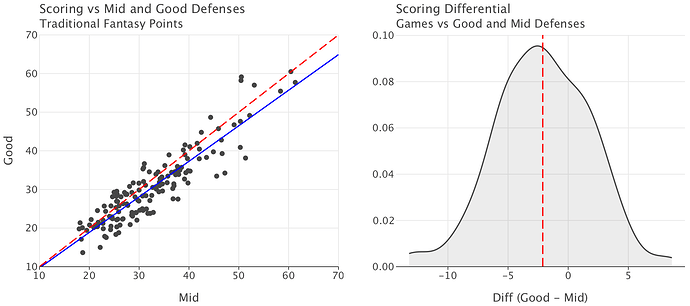
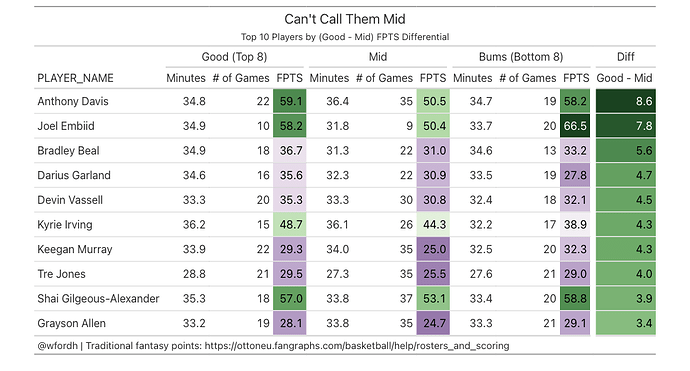
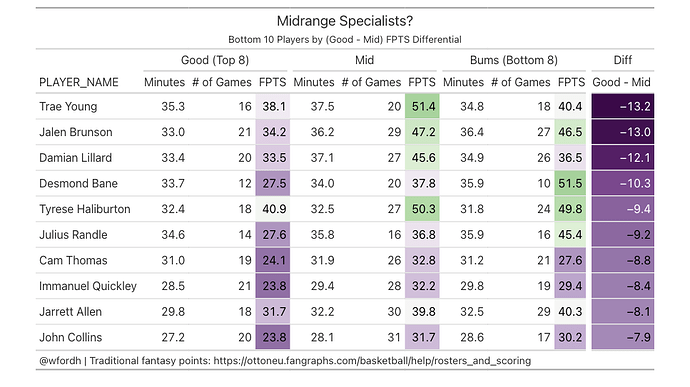
The NBA schedule is long, grueling, and comes with all sorts of decision points for managers filling out their 30 games in an Ottoneu lineup. Should you play someone on a back to back that is their team’s 3rd game in 4 days? Should you take a chance on a player stepping into the starting lineup? Should you worry about playing Spurs players when they go on the road for weeks while the rodeo is in town? Should you target weak opposing defenses?
Starting the insight process into these questions is the goal of this post. I won’t cover each one here, but hope to get to them in the future. This analysis will use traditional fantasy points as the basis despite lineup decisions being the toughest in categories leagues since TFP tend to be a midpoint of sorts between categories and simple points as well as more easily translated to the game level than categories. I’m going to look at the performance of the top 150 players by total points scored during the entire NBA season (not just the period covering the Ottoneu season - a question I’d like to revisit another time) since these are the players most likely to be relevant in Ottoneu and it is roughly equal to the 144 players I use to set replacement level for my values.
Home vs Away
Overall
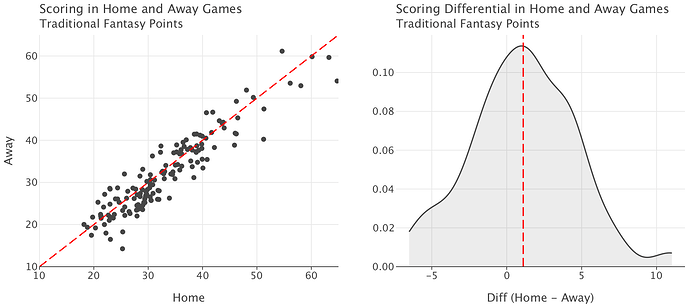
(note: dashed line is y=x in the left plot and the mean differential in the right plot)
Looking at the aggregate level we see the average player in our pool scores more at home than away, which is expected since home court advantage for teams has long been established and if the home teams are winning, then their players are playing better. The range for the distribution of the differences is also shifted more towards home scoring, with the x-axis reaching to +10 and only -6 or so, though the percentage of players occupying those extremes is fairly small, particularly in the positive direction.
The majority of the players fall into the range around -4 to +5, which isn’t a huge difference but could add up if you have a lot of players on road trips in a given week. It depends on each team’s makeup, depth, and each player’s schedule, but there are scenarios where it makes sense when picking your fringe starters to go with the player with home games.
Individual Players
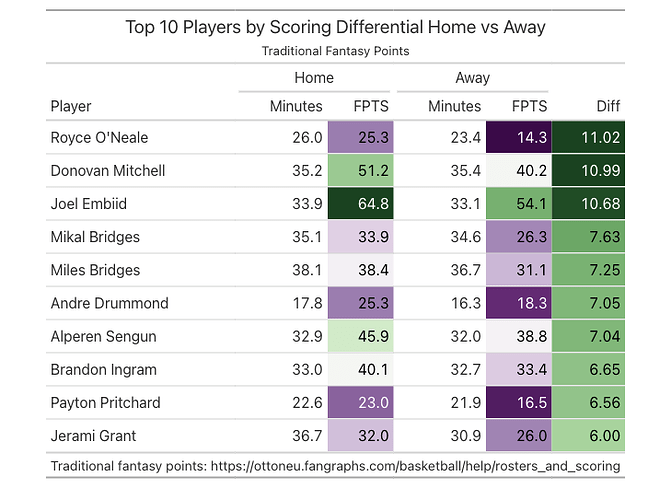
Diving into the specific players with the largest splits we see quite a few stars peppering the top 10 list for home cooking alongside a few role players. To me this is indicative of the potential home scorekeeper bias common in the NBA where star players tend to get crediting more leniently in statistics such as assists (+2 traditional fantasy points), blocks (+4), and steals (+4).
Embiid and Mitchell are the two biggest stars on the list and while neither played a full season, they both got more assists at home than on the road. Embiid received a significant boost in stocks (steals + blocks), recording 3.25 per game in 24 home games versus 2.27 in 15 home games - a four point boost by itself. Mitchell, meanwhile, did it simply through improved scoring as he put up nearly 6 more points per game at home and with better efficiency than he did away.
We also have a few true role players in O’Neale, Drummond, and Pritchard, and they’re all pretty straightforward cases. Drummond and O’Neale both shot the ball way better at home and recording stock totals at least 50% higher than their away games (note this does not discriminate between O’Neale’s time in Brooklyn and Phoenix). Pritchard shot the ball better at home as well, and also benefits from playing on a team that went 37-4 at home.
The last group here is the players who are clearly above replacement level but maybe not worth $50+. It’s a large range and not a well-defined one either since Sengun in particular may belong in the group with Embiid and Mitchell instead. Jerami Grant and Mikal Bridges stand out as players who are just barely above the universal replacement level of about 22 points when they’re away from home. Playing Royce O’Neale, who was nearly universally a $1 player, during home games would have been nearly as good as playing either Grant or Bridges, who both go for $20+, when they were away.
Of course, Ottoneu uses head to head matchups instead of season-long play so the schedule needs to line up to take advantage of these situations.
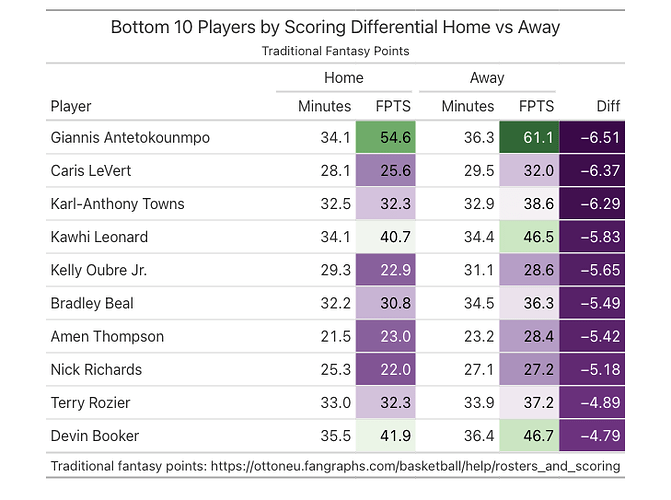
Oddly enough we again see plenty of stars for the players who do better on the road compared to at home. Most of the discrepancies for them (Giannis, KAT, Kawhi, Beal, Booker) seem to come down to
simply shooting better away from home. For those wondering about the third Suns’ star, KD performed about the same home and away.
It is interesting to see LeVert, Oubre, Thompson, and Richards and Rozier show up on this list since they all had star-level teammates show up in the previous chart. However, it’s tough to draw any conclusions based solely on these charts since many of those players dealt with their own injuries (or a trade for Rozier). Perhaps it’s related to teams trying to stay competitive on the road and not dipping into their deep bench as much since each of these players is certainly in the rotation for their team and sees an uptick in away minutes here.
Back to Back
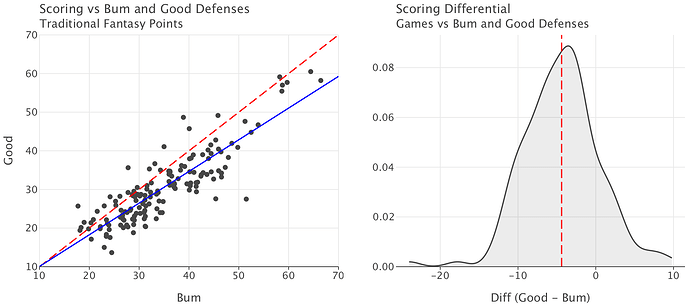
Overall
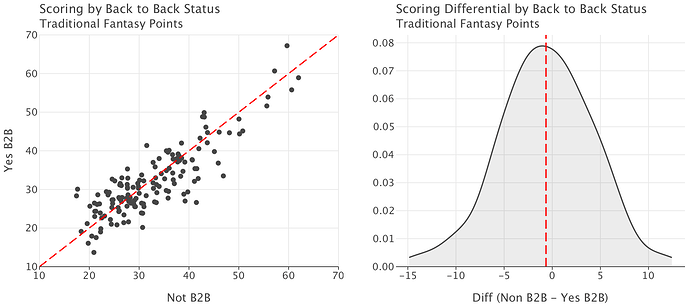
(note: dashed line is y=x in the left plot and the mean differential in the right plot)
Now we turn to another scheduling factor to consider - the back to back. While the home / away analysis was a fairly balanced dataset (5323 home games vs 5315 away), back to backs are far less common (8970 non-B2B games vs 1668 B2B) and the NBA continues to try and minimize them when creating the schedule. They have a pronounced impact on some players and even have a selection bias going on for this analysis since teams hold some players out on back to backs for various injury and load management reasons, such as how Al Horford didn’t play in both games of a back to back once all year.
All that being said, we do see a mean difference of barely less than 0 points and a distribution that is more symmetric than the home / away one, though this time the left tail goes further out from zero than the right tail. The distribution is overall more spread out than the home / away one with a smaller peak (~0.08 compared to ~0.10) for the maximum percentage of players at a point in the curve and a range stretching from -15 to +12 here.
Individual Players
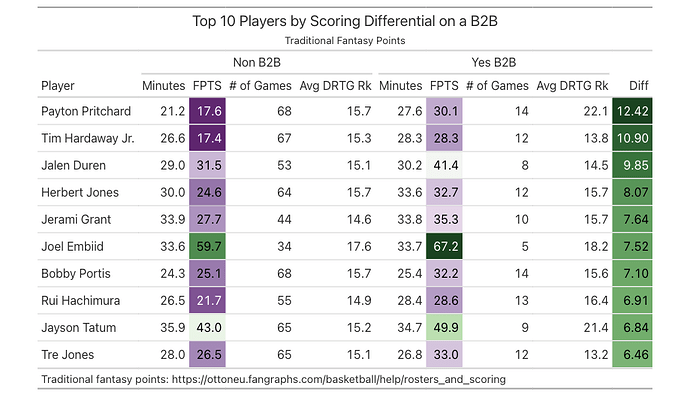
We’ll start off with the players who performed better on a back to back, and here I’ve included some additional information with the number of games in each sample and the average rank of their opponents’ defensive rating to help inform our takeaways.
Immediately we see the effect of Horford sitting out the back end of a back to back with Payton Pritchard and Jayson Tatum upping their games, though they also benefited from facing poor opponents on these back to backs. Other players who benefited from their teammates sitting games were Herb Jones (Zion Williamson), Bobby Portis (Khris Middleton), Tre Jones (Victor Wembanyama), and Rui Hachimura (LeBron James and a little bit Anthony Davis). Tatum and Tre Jones also pulled off the tough task of increasing their output while seeing their minutes decrease by over one per game.
There aren’t clear explanations for Grant, Duren, and Hardaway Jr to me, but if I’m missing something, let me know!
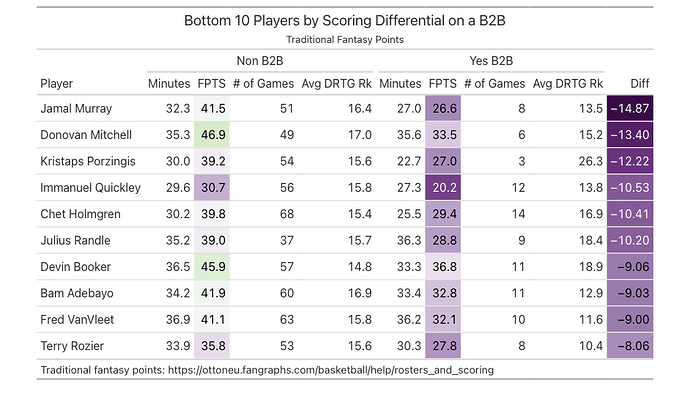
Now to the players who dropped off and it’s headlined by three guards in Jamal Murray, Donovan Mitchell, and Immanuel Quickley. Murray dealt with minutes restrictions on back to backs as he ramped up from injury, though he still managed an above replacement level 26.6 FPTS. Quickley struggled at times with his increased responsibilities after his deal to Toronto, which is reflected here.
Porzingis can more or less be tossed out of this dataset since he only played in 3 B2Bs all year - Boston often had him sit the first one when Horford played before sitting Horford in the second - and one of them he only played for 6 minutes and 14 seconds.
Booker has seen a dropoff the last two years, but in the 2021-22 season he was amazing in 10 B2Bs. Randle has dropped off in general on B2Bs the last two seasons, and particularly in steals and blocks. It’s a similar story for Adebayo, though he also suffered from a lack of Jimmy Butler (only played in 6 B2Bs).
Chet Holmgren is the last player I want to mention since he saw a large drop off, which isn’t surprising considering his lean frame and his status as a rookie. Although I don’t have any research to back this up, I would imagine that both of these factors were working against him on B2Bs. However, despite tying for the most appearances in B2Bs of the 20 players listed in these charts, the 14 B2Bs for the Thunder last year are about average for an NBA schedule.
Conclusions
I dove into some of the statistical artifacts from this past basketball season based on dimensions of the schedule to see how players performed in different situations and saw it can impact lineup strength quite a bit. It could change how you fill out your lineup, particularly the UTIL spots in weeks where maybe the stars aren’t playing as much and team depth is tested. It’s also another situation where finding a handcuff of sorts is beneficial, as when a team sits a player consistently on B2Bs, other players will step up. Or if you know a player steps up at home, maybe you can steal a start with them to fill out the lineup.
However, at this point there aren’t any firm conclusions as these are all summary statistics and I haven’t done any work to see how this translates from year to year. I’d like to do some work there to see if we can expect players to bounce back from one year to the next, if particular locations influence the home / road splits, and other insights.
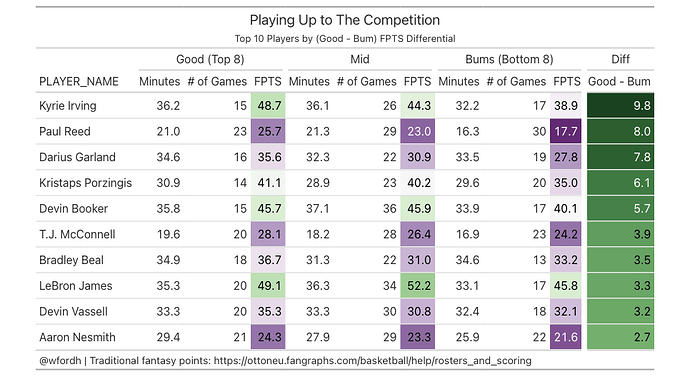
Before that, though, I’m planning to finish off the summary stats with a look at how players perform based on their opponent’s defensive rating rank to hopefully gather some insight on which players beat up on weak teams and if using opponent defense strength as a tiebreaker makes sense when picking starters.
