A few decades ago, Ron Shandler coined the terms “stars-and-scrubs” (SAS) and “spread-the-risk” (STR) to describe roster strategies in terms of salary allocations. In case it isn’t clear from the names, SAS basically means investing a lot in superstars (and thus also a lot of low cost players) whereas STR involves evening out the salaries across your players. They really exist at two ends of a spectrum: the most extreme SAS would involve spending $341 on one player and (24) $1 players whereas the most extreme STR would involve (25) $16 players. All teams are of course somewhere in the middle.
Economists have a measure of income inequality called a Gini Coefficient, which is usually used to measure income inequality within countries. It ranges from 0 to 1, with 0 indicating perfect equality while 1 indicating extreme inequality. For example, Sweden has a 0.25 Gini while the US has a 0.47 (CIA World Factbook, 2013). In Ottoneu Basketball, the pure SAS team would have a 0.90 Gini (since $1 is the minimum salary) while the pure STR team would have a 0.00 Gini.
As a preliminary step, I just looked at the salary data by team in the (8) H2H 9 Cat basketball leagues (it’s somewhat tedious to assemble the data, which is why I didn’t do the points leagues). So I downloaded their rosters, calculated the Gini by team, and then matched up the team win totals. Summary statistics on the Ginis by team across the 8 leagues are as follows:
- mean: 0.6467
- stdev: 0.0848
- min: 0.4063
- max: 0.7112
In an ideal world, I would have captured the rosters immediately after the auctions. However, I didn’t think of this until today, so hopefully the Gini Coefficients based on today’s rosters are close enough to what they initially were.
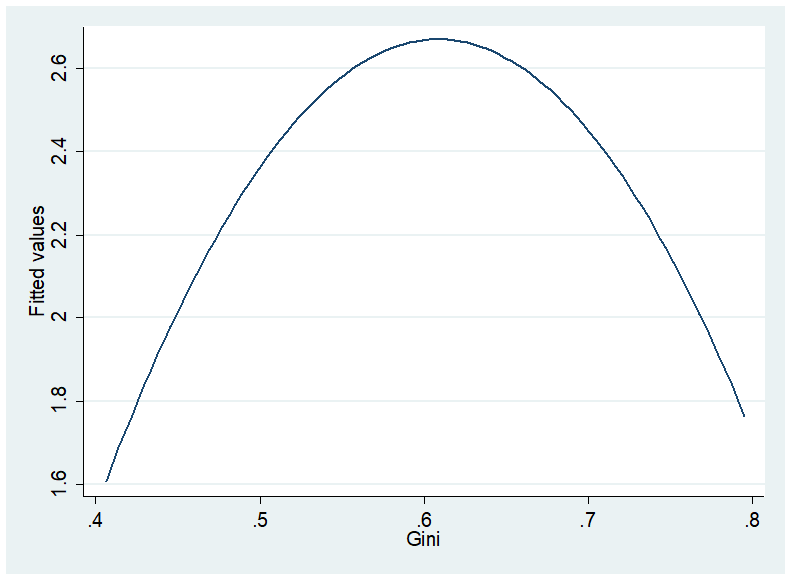
Next, I merged in the win totals for each team and ran a simple OLS regression (Gini on wins). I was hoping to find something statistically significant to report, but instead the coefficient was remarkably non-significant (p-value=0.96). Based on these preliminary results, I’m not going to bother to assemble and analyze the data for points leagues.
So there you have it: you can win in Ottoneu Basketball (at least so far) with either a SAS or a STR approach. Maybe that should have been obvious from the start, but I was curious to see if it was empirically true.
EDIT: See following post–results are actually significant.