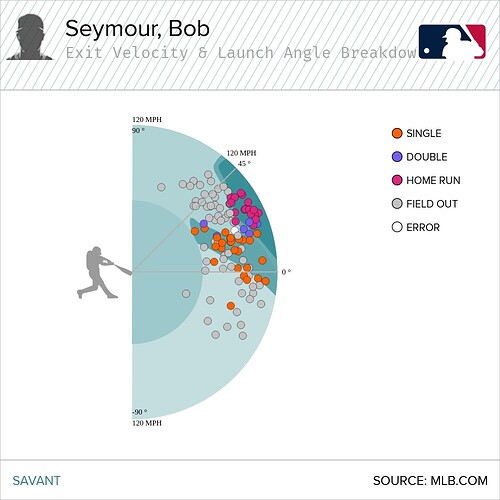
I spent some time this summer trying to recreate the Baseball Savant hitter radial chart that was one of the first splashy designs used in the early days of Statcast, of course I eventually found out it was all for naught since the chart was just hidden away and still existed.
But while searching, I got pretty interested in the data MLB collects from the few single-A and triple-A parks where the Hawkeye system is currently available. At first, I was diving into the data trying to find out how hard Victor Mesa, Jr. was hitting the ball in the hopes he could be an underrated addition to my floundering Ottoneu team’s growing prospect list (spoiler: not as hard as his early season homerun total suggested). After rejecting that premise, based on his middle of the pack ranking for average EV (he ended up 334th out of 547 hitters with 100 or more balls in play on the season), my quest for relevancy in the MiLB ranks led me to the hitter then atop the xwOBA list, Bob Seymour. Unlike some forum readers who were given a titular clue, my first thought was, “Who?”
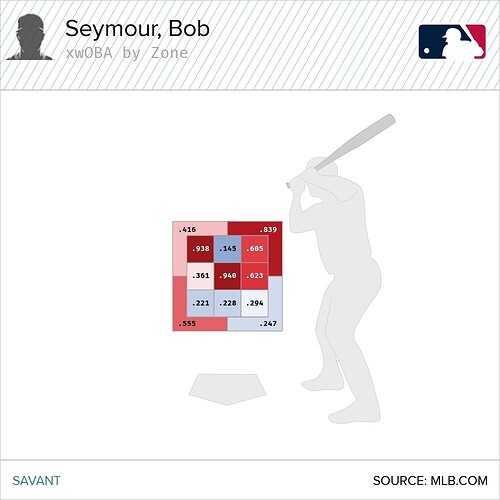
So, I needed a little background. Bob Seymour is a Rays prospect, who, when he hits the ball, puts a wallop on it. I mean, just look at this xwOBA by Zone chart:
Seymour is an older first baseman, he was 25 for the 2024 season and looks a little Bob-Hamelin-ish from his highlight reel. In the end, that 34.9% strikeout rate and 21.2% swinging strike rate (found on his Fangraphs profile no less!) scared me off from starting any checkout-aisle-style auctions.
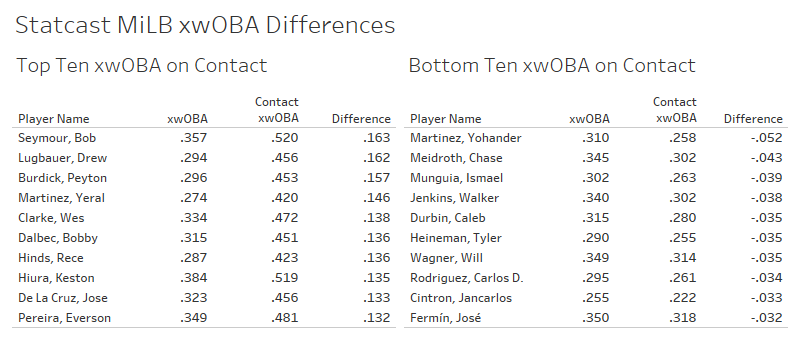
But this led me to a new question, who are the hitters with the largest differences between xwOBA overall and xwOBA on contact? Is this a group that can tell us anything or provide some new clutch of raw talent to search through? Pulling down the data for all tracked pitches, and all ball in play events, I compared the two values for xwOBA and put together a quick top and bottom ten for the 2024 season:
There’s our boy Bob atop the leaderboard again, much as when I first looked during the season, but he’s also seemingly unique in that the other hitters on this list didn’t fare well overall or are trying to avoid the dreaded Quad-A label. Without improvement to his ability to make contact, if not his contact quality, Seymour is probably trundling along that same path.
The bottom ten by delta from overall does contain some interesting names, like Walker Jenkins, and it’s probably worthwhile to investigate how they ended up here or if injury played a role in contact quality. Maybe a deep dive for another day.
Wrapping things up, that radial chart…turns out when you search the Statcast MiLB data, there’s a “Graphs” header on the far right. The modal window that pops up includes links to various visualizations, including that ever elusive radial chart:
Hope this has been at least interesting, but now back to arbitration!


