I know that during the season, Fangraphs’ Depth Chart projections are a mix of Steamer and ZiPS rates with playing time manually set by Fangraphs. I also know that Steamer publishes much earlier in the spring than ZiPS, so there’s a period of time where the Steamer and Depth Chart projections are identical. What I don’t know is what these are, so early in the offseason.
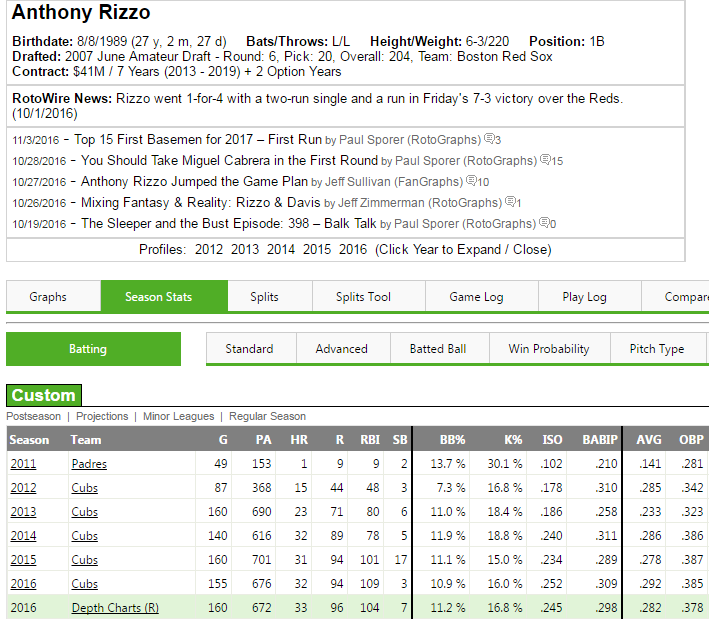
I don’t think these are simply last year’s Steamer and ZiPS. Gary Sanchez is projected for a .219 ISO and .334 wOBA; ZiPS had him preseason at .194 and .315. I’m not sure where the PT is coming from, either: David Ortiz is projected for 644 PA, so it’s not manually predicting 2017, but Gary Sanchez has 518 PA, so it’s not going back to pre-2016 predictions. Nori Aoki has 140, so it’s not some variant of the Steamer600 projections; each team’s PT by position actually foots to full seasons on the Depth Chart pages: http://www.fangraphs.com/depthcharts.aspx?position=ALL&teamid=21
So, where are the rates coming from, and where is the PT coming from?
I think (but I don’t know for sure), that those Depth Charts ® projections are using the RoS rate projections for ZiPS/Steamer as of the end of the season. I’m not sure about the PT projections, they are usually pulled directly from the FG Depth Charts. Spot checking Gary Sanchez, he does show up with 518 PA on the Yankees Depth Chart (http://www.fangraphs.com/depthcharts.aspx?position=ALL&teamid=9)
That makes a lot of sense for the rates. Thank you, I hadn’t thought about what the “Rest of Season” stats would look like before the last day of the season. But those Depth Charts pages are manually put together by Fangraphs staff, or were when they were introduced. Who’s putting them together now, and what are they meant to approximate?
If you were projecting 2017 playing time, even the most casual of estimates wouldn’t use 91% of Boston’s DH PA on David Ortiz. If you were going back to pre-season, you wouldn’t have 72% of Catcher PA going to Sandy Leon. That even exceed’s Leon’s actual 2016 playing time (41% of Catcher PA).
I’m not actually concerned with how they’re projecting part-time players playing time at this point. What I’m more curious about is whether they’re accounting for health and age risks. Carlos Beltran is old and was healthy last season for the first time in 3 years. They’ve got him down for 150 games. Is that because they’re just talking about 2016, when he was healthy, or is that an honest projection based on his past health?
The Depth Charts are definitely still manually maintained by the FG staff. My guess is part of the process involves allocating a % of PA, and the Depth Charts as shown right now reflect the playing time allocations the last time they were updated (likely late September). Players hurt as of the end of the season and not expected to play RoS don’t have PA, as an example (Greg Bird, David Peralta, etc).