Yellow team not having a bunch of starters on a getaway day (4/12 was a Thursday) is the other read for that big graph (to play devil’s advocate). An owner is going to have to do more research either way to figure out what that dip means, and hopefully they are already doing that work. Like, the team in Yellow probably doesn’t need that graph to inform them that they are in 11th place, and making rash changes because they just didn’t play a lot of players on a Thursday would be the wrong takeaway, right?
Graphs that are vague can lead to a lot of bad analysis, so I’d prefer not to provide vague graphs. The points per day graph is significantly better for the kinds of analysis you’re speaking to (i.e. my points per day have dipped and I’m in 4th but that won’t last so I should make a change), so I’d again recommend considering that graph.
Totally understand your point. I definitely agree it isn’t a necessary thing to have and that owners should do their due diligence when they are thinking about making a move. For me though, I am in a league with 1 of my best friends and a bunch of other random dudes. If I checked the Standings page and scrolled down to this graph and see that I outscored my friend 4 days in the last week, it would bring joy to my heart. Again, not a necessity. I could add up the numbers myself, it just takes a bunch of time. In that sense the CHG column is definitely appreciated.
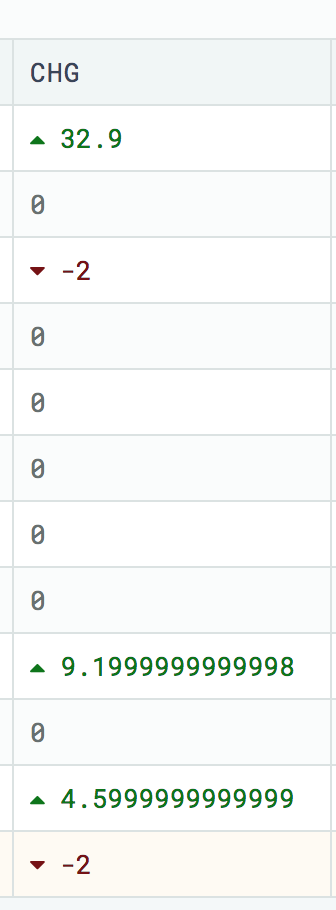
Great addition! But could the point changes be rounded to maybe just a couple decimal places? At the moment 10+ decimal places are being included for some teams, pushing the P/G and P/IP columns way off to the right.
I also see your point about the noise of a daily points graph. Especially in H2H leagues with 2 SP spots, low point days are understandable bumps. While I still miss the snapshot comparisons of point totals (or any other categories), it is mostly, like had been mentioned, for bragging rights.
However, I wonder if maybe the graph we want is weekly points totals, rather than daily? Weekly data points would smooth out the noise enough to spot tends, without the variance degradation found in average tracking.
Ha! I suppose I don’t mean “trend”. I mean: “look at who’s butt I kicked this week after scoring nothing last week”.
I guess I’m not so interested in the analysis as much as record keeping and historical performance. This is likely the philosophical difference in our goals for these graphs: performance versus prediction.
This nails it. Those graphs are definitely meant for prediction and analysis and a better understanding of how your team will perform, not a historical record of how your team has performed. Always looking forward, etc.
I think the solution for the historical record is probably something that isn’t a line graph, but I don’t know what that thing is…
I’ve added a new table to the standings page for points leagues. It is titled “Recent Points Performance”. It has point changes over 1 day, 7 days, and 30 days for each team in your league.
I’m only in a H2H league, so no change to check for us, if I understand you correctly. Wouldn’t mind having it on H2H as well.
Sounds cool, though- I think that’s likely a good solution.
EDIT: NEVER MIND- I’m an idiot. I see it now. Was looking for a graph- but I like the table. For H2H it would be nice to have weekly columns, but Schedule page mostly does this.
I’ve added a CHG column for roto leagues, showing the change to total score from yesterday. I’ve also added the CHG column to the homepage for season-long (non-H2H) leagues.