Low priority, but I would love to see ottoneu baseball keep track YTD of all the scoring on your bench in a separate tab or window. It would be great at the end of the year to see how many points you forfeited by playing the wrong player over and over again.
This is somewhat related to my previous request of being able to see YTD scoring by position, not just by players you currently own, so you can actually determine how well you managed your team (in each position slot) throughout the season.
Looks like someone else had this idea four years ago, but it’d be a cool, although admittedly very low-priority, thing to see on the page. I was daydreaming yesterday about there being a “lineup efficiency” metric somewhere in the standings that would show how well teams did with their lineup choices over the course of the year.
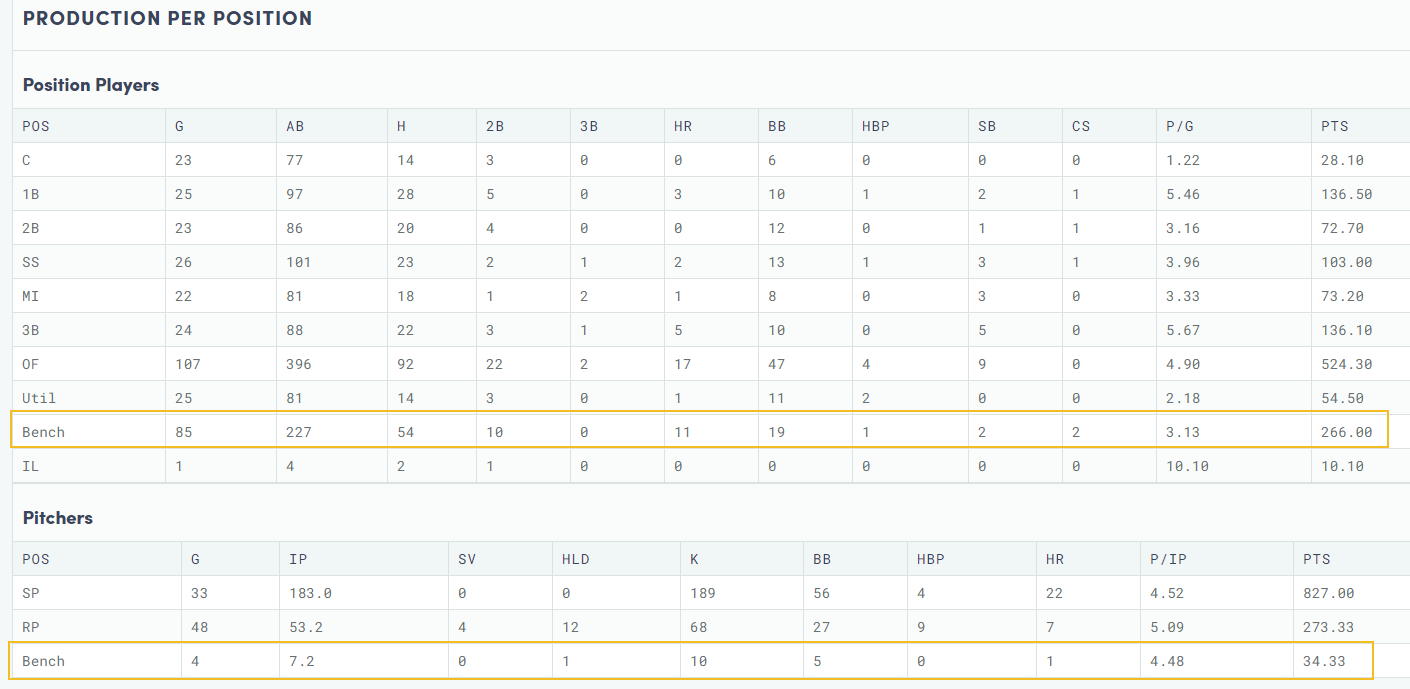
For reference, this can be found either at the bottom of the lineups page, or on the team production page: https://ottoneu.fangraphs.com/[league number]/teamproduction
Niv – a question about this: once a team has blown past their innings / games played caps, will points they would have accrued if they were still below the cap be shown as “bench” points?
Thanks, that makes sense. A few other thoughts / questions here, and perhaps this is better under Tools, but this seems so basic that I don’t want to presume this is a useful tool for anyone so I’ll just keep rambling on here for a bit.
I did a quick analysis for my league (652) using the bench scoring so far to try to determine a “lineup efficiency”, which basically is just figuring the percent of bench points compared to total points scored. Results here:
It’s interesting and probably gets at useful info, but in some ways it can be pretty deceptive as well. Teams that are being very vigilant to stay right at the IP and GP cap levels will by definition end up leaving more points on the bench than teams that are just starting everyone they can now, so those hell-with-the-caps folks will look more efficient, for the time being, than those pacing themselves but it should balance out as the season goes on (thus my previous question about whether the bench line accounts for stats of “starters” once the caps have been exceeded).
I am very much not a stats person so I welcome any thoughts for those of you more inclined, but one other idea I had to crack this nut is instead of looking at point totals, to look at the ratios to get a better sense of efficiency. By that I mean, would comparing the P/IP & P/G of starters vs. the bench yield more interesting results and be somewhat less prone to being distorted because of volume? In other words, perhaps that would get at the answer I’m seeking, which is how good are various managers in picking who to start?
So thoughts welcome on whether that even makes sense statistically. Also one request for Niv – would it be easy for you to add a “Starters” summary line to the Team Production page for both hitters and pitchers? It’d be interesting to see that as compared to “Bench” and then would make my above half-ass analysis easier to do. I can also just cut and paste from all the Team Production pages manually do it, too, I realize, but just thought I’d ask.
Ha – yeah, good point. I’m hoping to break it down by hitters and pitchers, though, and perhaps missing something but I don’t know where to find that other than to just calculate it from the Team Production page. But now that I’m typing this, I realize I could just use the P/G and P/IP rations rom the Standing page and then calculate ratios for the bench scoring from the Team Production and that would be easy enough. Thanks.
The standings page is every team’s starters production and some of the stats are pitching stats and others are hitting stats. I sense you may be overthinking this but maybe we are just agreeing.
We are agreeing both on the substance and that I’m over-thinking it.
The site does indeed have the data that I need to try to figure it out, so all good. Now whether my idea that comparing the ratios of starters to the bench tells us anything useful about lineup management is another matter, but I’ll keep chewing on it.