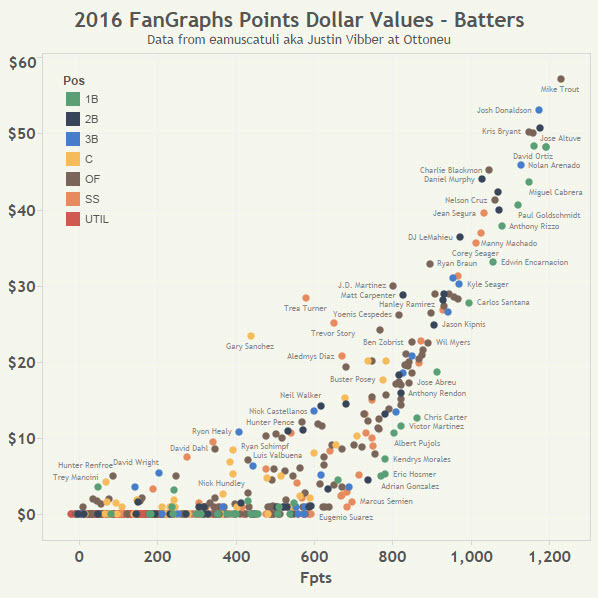
Here are my calculations for actual dollar values in FGPTS for 2016. I’ve calculated the baselines as the last player needed at each position to fill Games or IP caps, and applied a 62/38% split between hitters and pitchers (the same split I use for my auction values). edit- based on the actual Points Above Baseline totals for Hitters and Pitchers, the value split comes out to 61.7% hitters and 37.3% pitchers, close enough to my 62/38 split that I’m comfortable with it
Awesome! Thanks for putting this out
2 Likes
Looks like those 1B’s are providing some good value!
And pitchers:
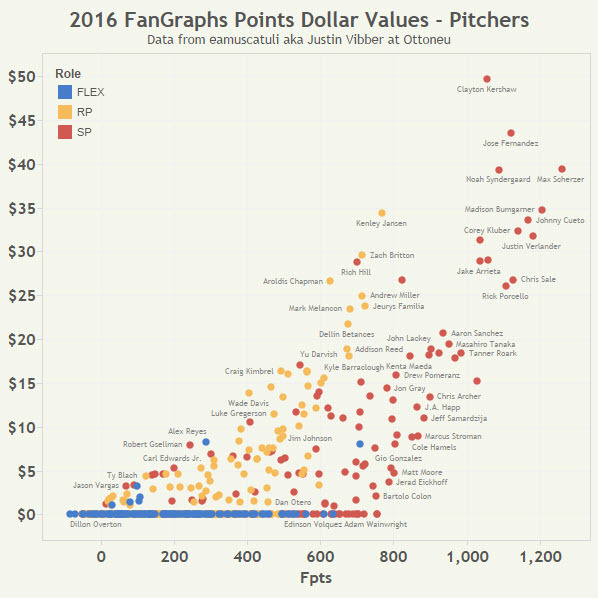
Interactive versions of these two graphs can be found here: https://public.tableau.com/profile/rj7974#!/vizhome/2016FanGraphsPointsDollarValues/Batters
RJ
2 Likes
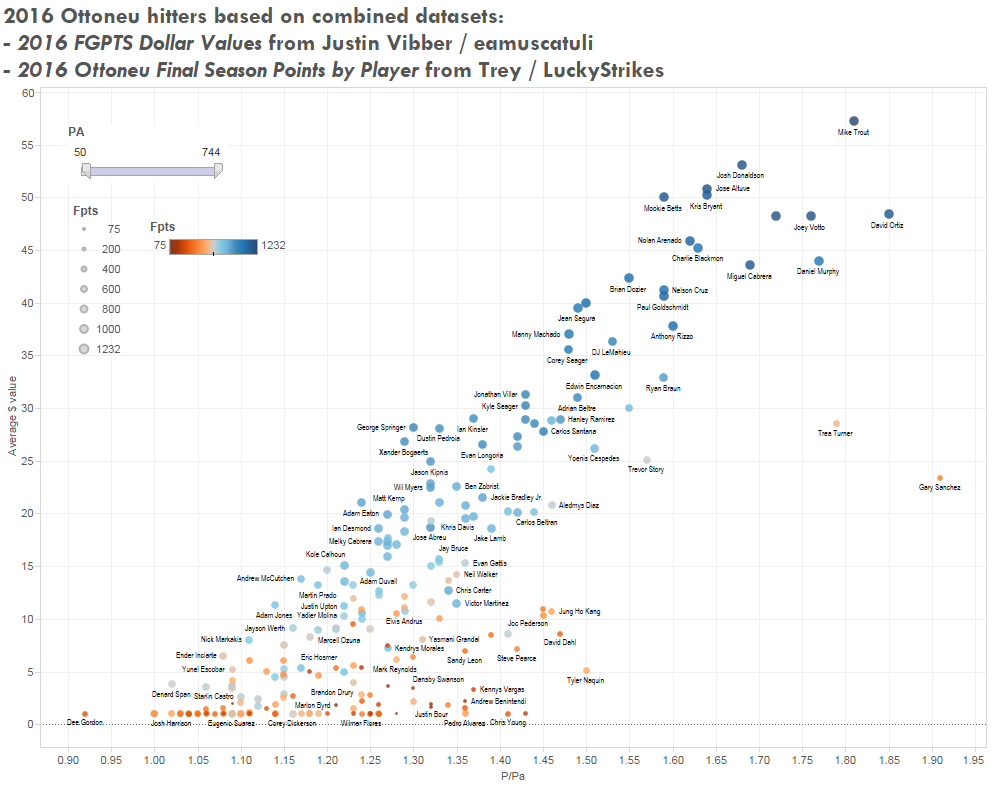
You may already have this @rjweise but here are the end of year Average Values across Ottoneu. We’ll update this again right as arbitration start to sort of set the line in the sand for how we’ll compare value change before and after arbitration for 2016.
I definitely have some ideas for RotoGraphs/Community content to compare Actual 2016 values to our preseason consensus values and average salaries.
1 Like
This is great @LuckyStrikes. One thing though I was discussing with @nivshah is that these tables don’t have the Fangraphs ID which makes it hard to link to other data, for example to show points/$. I tried linking based on names, but you run into Wiliam Meyer <> Wil Myer. Niv said he may look into adding the FG ID to the data if he has time.
Thank you for sharing though!
RJ
Now we’re talking! So by combining the google sheet provided by @vibbot above and the one by @LuckyStrikes here I can now combine player points with value, as well as their 2017 positions. The number of records even match, although I’m starting to think you guys work together and just take turns publishing?
You guys rock!
2 Likes
Quick note- there was a question about why I used a 62/38 split for hitters/pitchers, and whether using actual Points Over Baseline totals splits would be better. That POB split is actually 61.7% for hitters, or close enough to my 62% that I’m comfortable leaving the values I calculated as is.
FYI - Carlos Gomez is listed as a 3B in the spreadsheet.
Well that’s just silly, Gomez doesn’t play 3B. I’m not going to bother changing it though, he’s $0 whether at 3B or OF.
Justin / @vibbot , can you elaborate on where the values you use when calculating the POB (i.e. 4.23 for Catchers) are coming from? I thought they might be the position average for Pts/G but that doesn’t work out. And are those values arbitrary based on personal preferences?
Based on further comments I have a feeling they may be related to the Hitter / Pitcher split?
Thanks!
RJ
The baseline I used for each position was based on sorting all players at the position by Pts/G and then finding the Nth player needed to fill all games for the league. So the 4.23 baseline for Catchers represents the fact that the lowest PPG C needed to fill 1,944 C games had a 4.23 PPG. The same thing was done for every lineup spot and SP/RP. Hope that helps!
Thank you, yes it does help and I can replicate what you are saying.
Cheers!
I’m still unclear on a few things, if you don’t mind?
I figured out you look at 2B, SS and MI as three positions and then look up the 31,944 games to get the PPG value. Same for 5 OF, looking at 51,944 games, and 3B for 1,944 games.
This logic however seems to fail for the 1B (4.69) and UT (4.35). Are you doing some sort of combo here, as some players will typically be splitting between 1B and DH?
And applying the same logic, wouldn’t you want to look at 2*1,944 games for C as you can roster 2?
I didn’t look at Pitchers yet, and I assume that gets a bit complicated with FLEX pitchers and such, although I noticed you split up innings between pitched as RP and SP.
If there is any document out there that explains this, please can you send me a link? I don’t mean to take up your time, but just trying to understand the logic.
Thanks,
RJ
1 Like
Hi @vibbot, any chance you can guide me on the right track, or am I just missing something obvious?
Thank you,
RJ
The Util replacement level on the sheet really doesn’t matter, because there was no one over $1 at that eligibility. I can’t seem to back into exactly where I got the 4.69 for 1B, but it definitely includes some additional players to fill Util slots.
As for catchers, there are two spots in the starting lineup for ottoneu, but the cap is still 162, so it’s only 1,944 games that should be allocated to catchers.
For pitchers, I did try to estimate how many starter IP and relief IP for each pitcher that relieved and started a game, and applied separate replacement levels for each set of IP. Otherwise you either overestimate the value of a SP/RP if you compare him against SP, or underestimate if you compare him just to RP.
thank you for the response Justin!
Hi @vibbot thanks for developing this tool! Was just wondering if you could explain where the 9.56 in the dollar calculation for hitters comes from? As well as the 9.89 for pitchers. If it is part of your personal calculations for dollar values I understand not passing the information on.
1 Like
Those numbers correspond to the total Points Above Replacement for all hitters/pitchers divided by the marginal dollars above $1/roster spot for hitters/pitchers. So every 9.56 in hitter PAR is worth $1 (above the minimum $1). Hope that helps!
1 Like
Ah yes I understand it, thanks heaps!